EIC Formative Report
Implementation Strategy Analysis


Executive Summary
The current report presents results from analyses on the use of implementation strategies to answer the learning question: What is the “menu” of interventions taken by systems to support implementation? How does this vary by context? See the full summary for methodology and data visualizations.
Key Findings
The EIC Formative Report analyzed implementation strategies used by districts and providers in the 2022-2023 academic year. The data reveals significant variability in strategy usage across dyads. For example, districts with appointed superintendents consistently deployed a wider range of strategies compared to those with elected leaders. Additionally, several categories of strategies emerged as more prevalent, including professional learning, data collection, use and reporting, and utilizing implementation protocols. Conversely, strategies involving community engagement, communities of practice, leadership development, infrastructure building, and incentives saw less frequent use.
So What
Implications for Effective Implementation of Math Instructional Vision & Materials
1. Tailored Support and Context-Sensitive Implementation Strategies:
The observed variability underscores the need to provide more tailored support to individual dyads. This could involve increased coaching, focused resource sharing, and professional development opportunities matched to specific needs and contexts. This contextual support should also emphasize strategies for deepening its understanding of local contexts and adapting strategies accordingly.
2. Prioritizing Less Common Implementation Strategies:
To address the underutilization of certain categories of strategies, such as engaging families/caregivers, additional support and resources could be provided to use these strategies effectively and aligned to data-identified needs.
3. Clear Transition Plans and Data-Driven Decision Making:
For strategies currently used by providers, using data to inform clear transition plans is recommended to ensure smooth integration into district practice (including any planned deselection/discontinuation of competing or ineffective ones). Continued support to LEAs in developing their capacity, explicitly by using implementation data to inform decision-making and strategy refinement, is needed.
4. Exploring Strategy Effectiveness and Unmet Needs:
Focus groups and future analyses are planned in Spring 2024 to delve deeper into the reasons behind strategy usage and effectiveness variations.


Full Summary
The Effective Implementation Cohort (EIC) aims to increase districts’ capacity to implement a high-quality middle-grade math curriculum to accelerate learning for students experiencing poverty, Black, Latino/a, and/or English Learner (EL)-Designated students. The current report presents results from analyses on the use of implementation strategies to answer the learning question:
What is the “menu” of interventions taken by systems to support implementation? How does this vary by context?
Methods
Data were collected on various implementation strategies used by Provider-LEA dyads in the 2022-2023 academic year. The EIC team identified 57 implementation strategies from the ERIC complication research of implementation strategies (Powell et al., 2015) and the Active Implementation Frameworks (Fixsen & Blase, 2020), as well as additional strategies observed by the EIC implementation specialists.
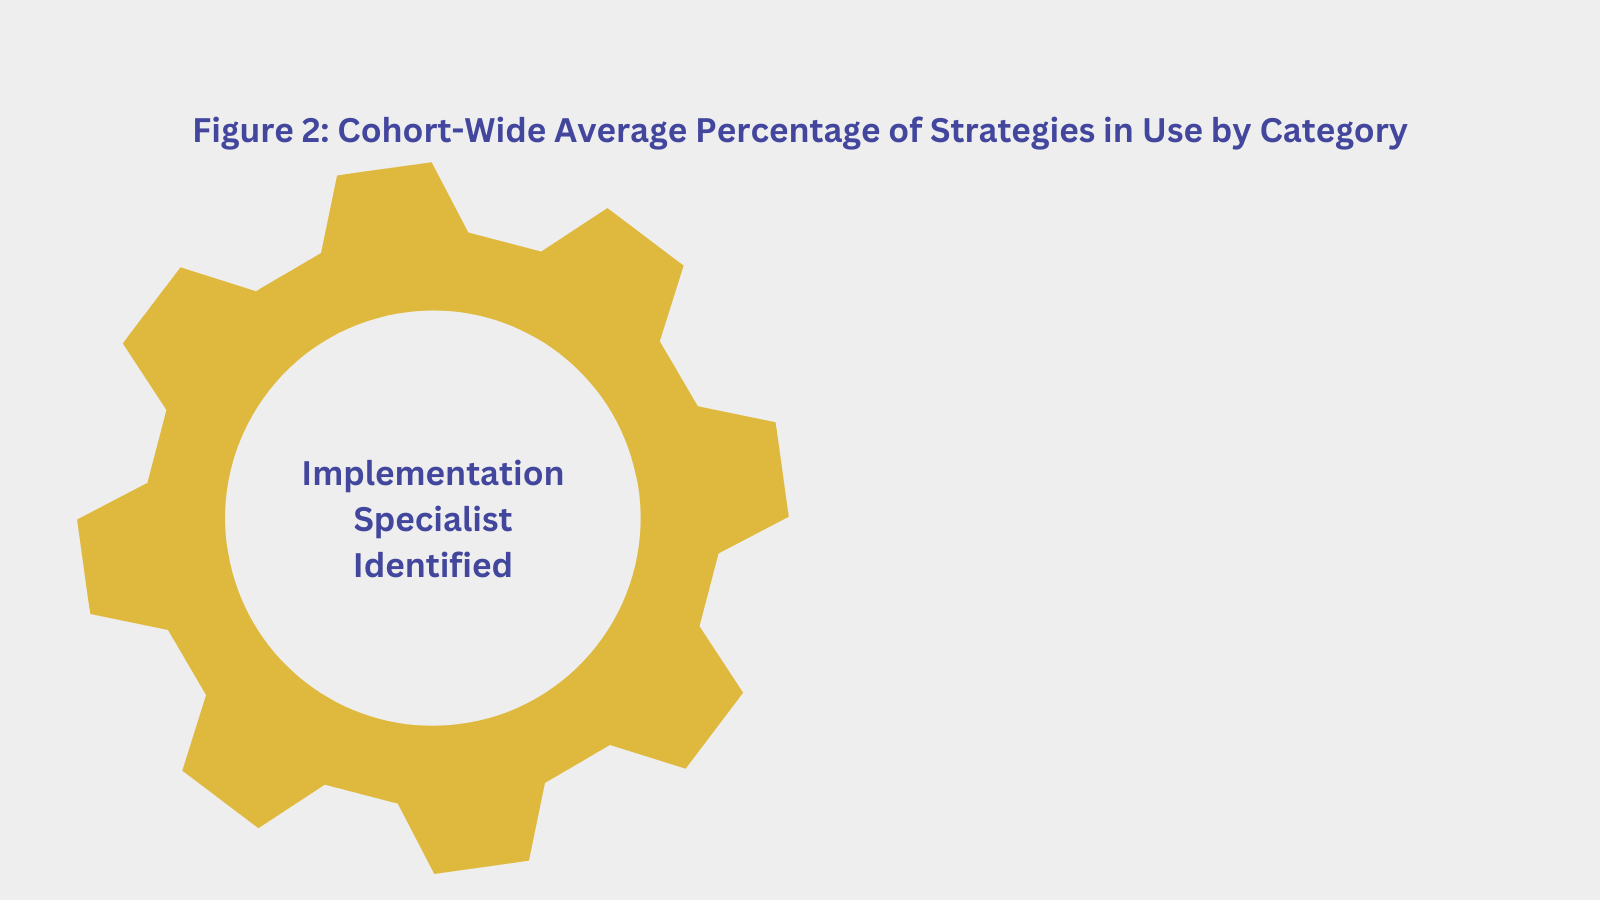
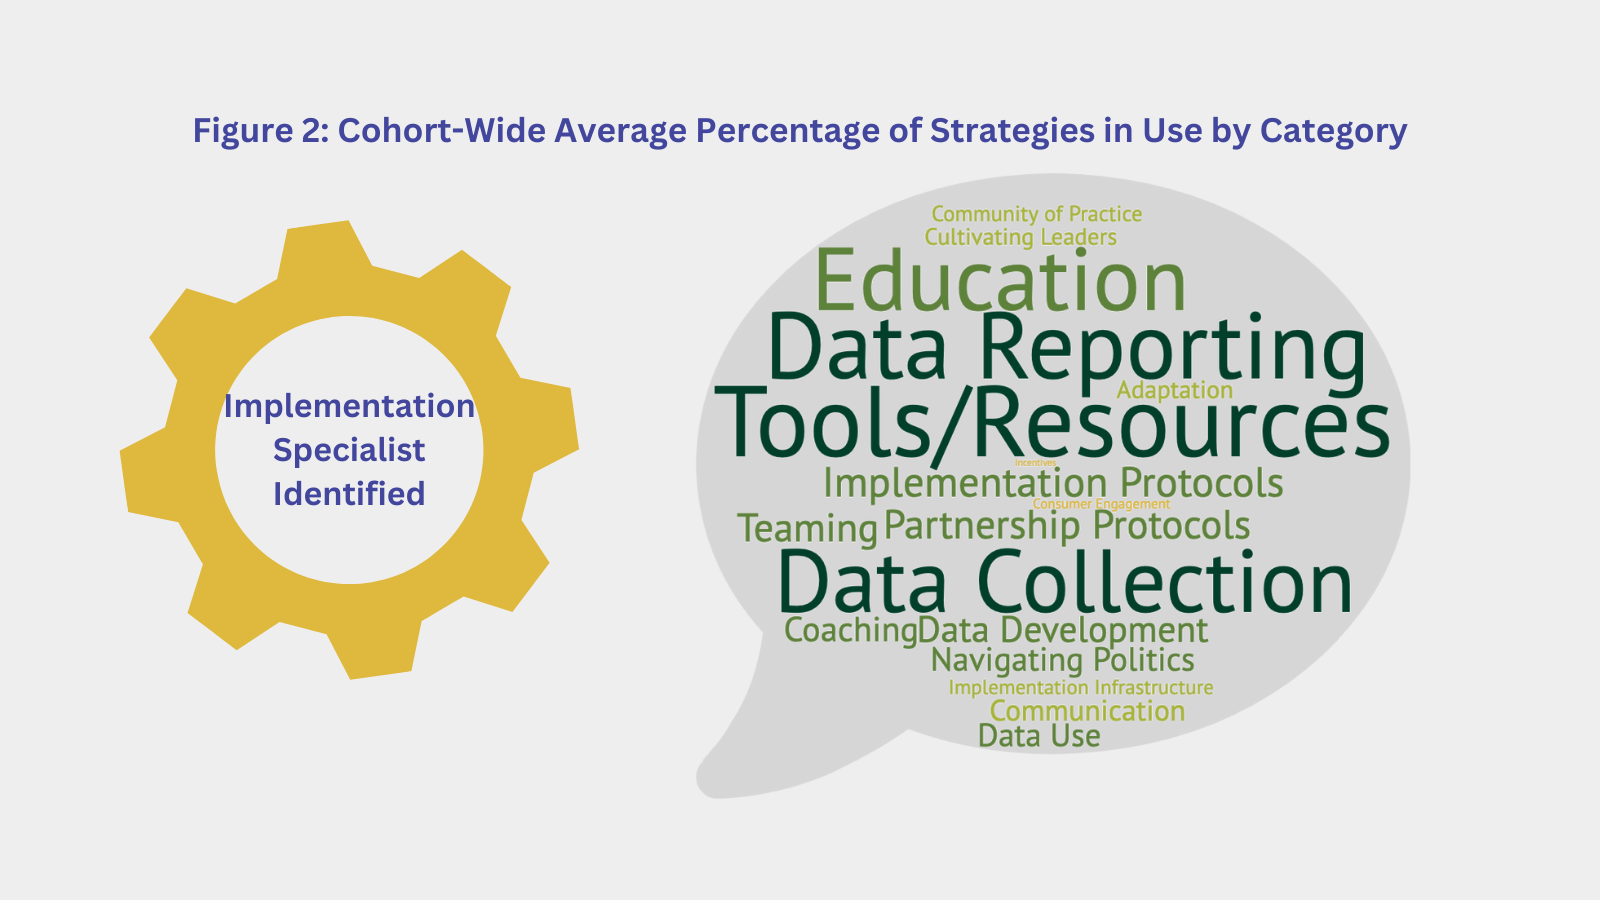
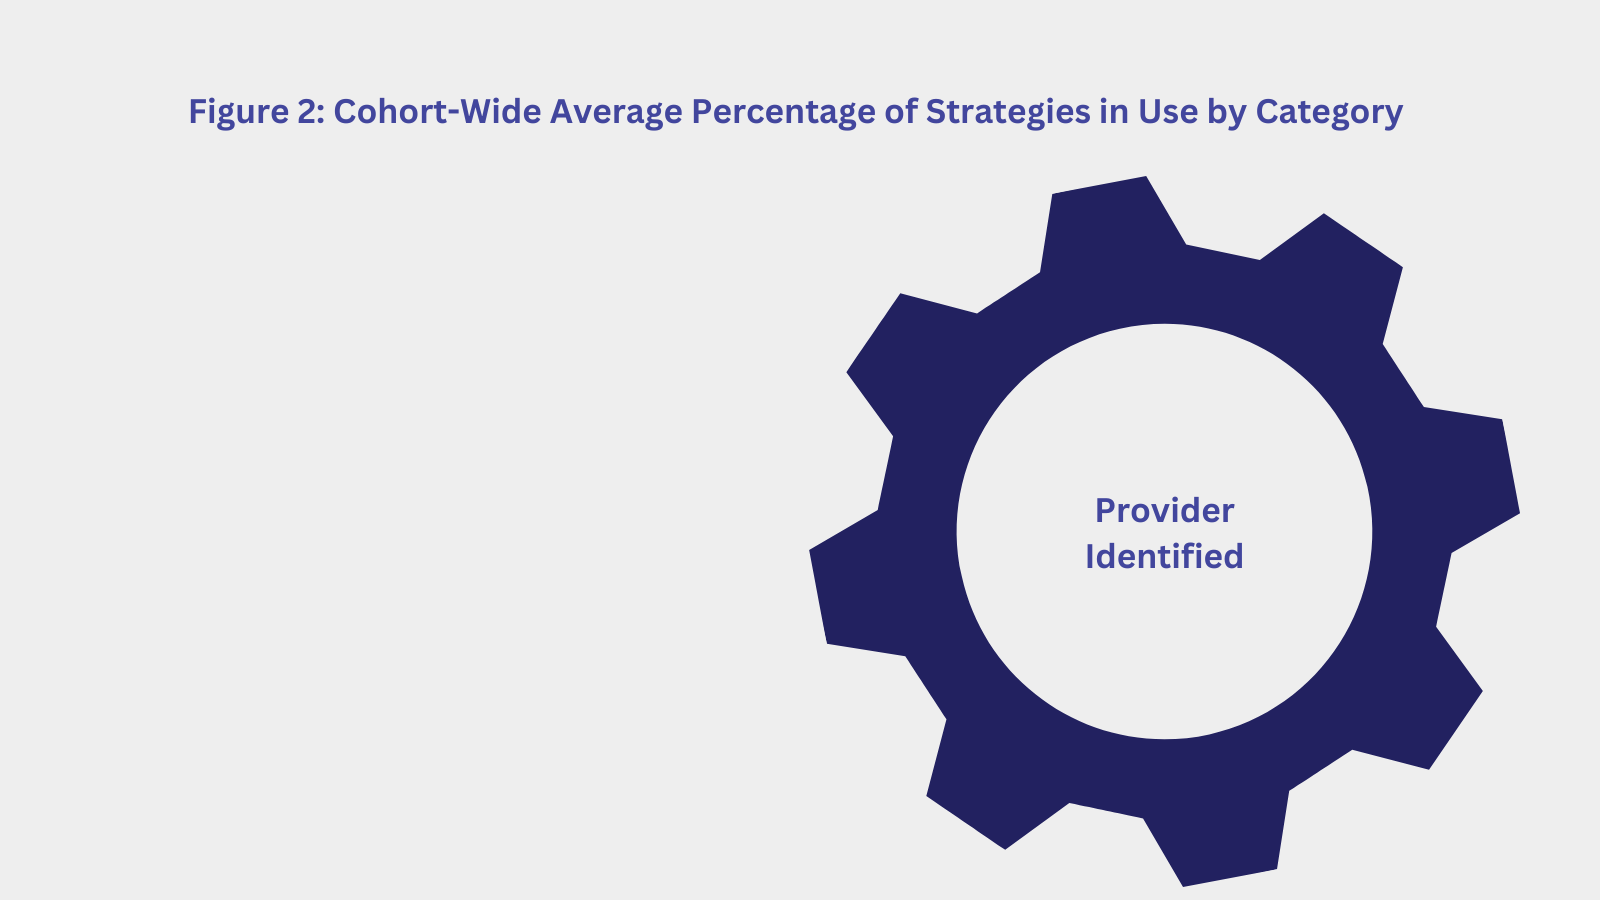
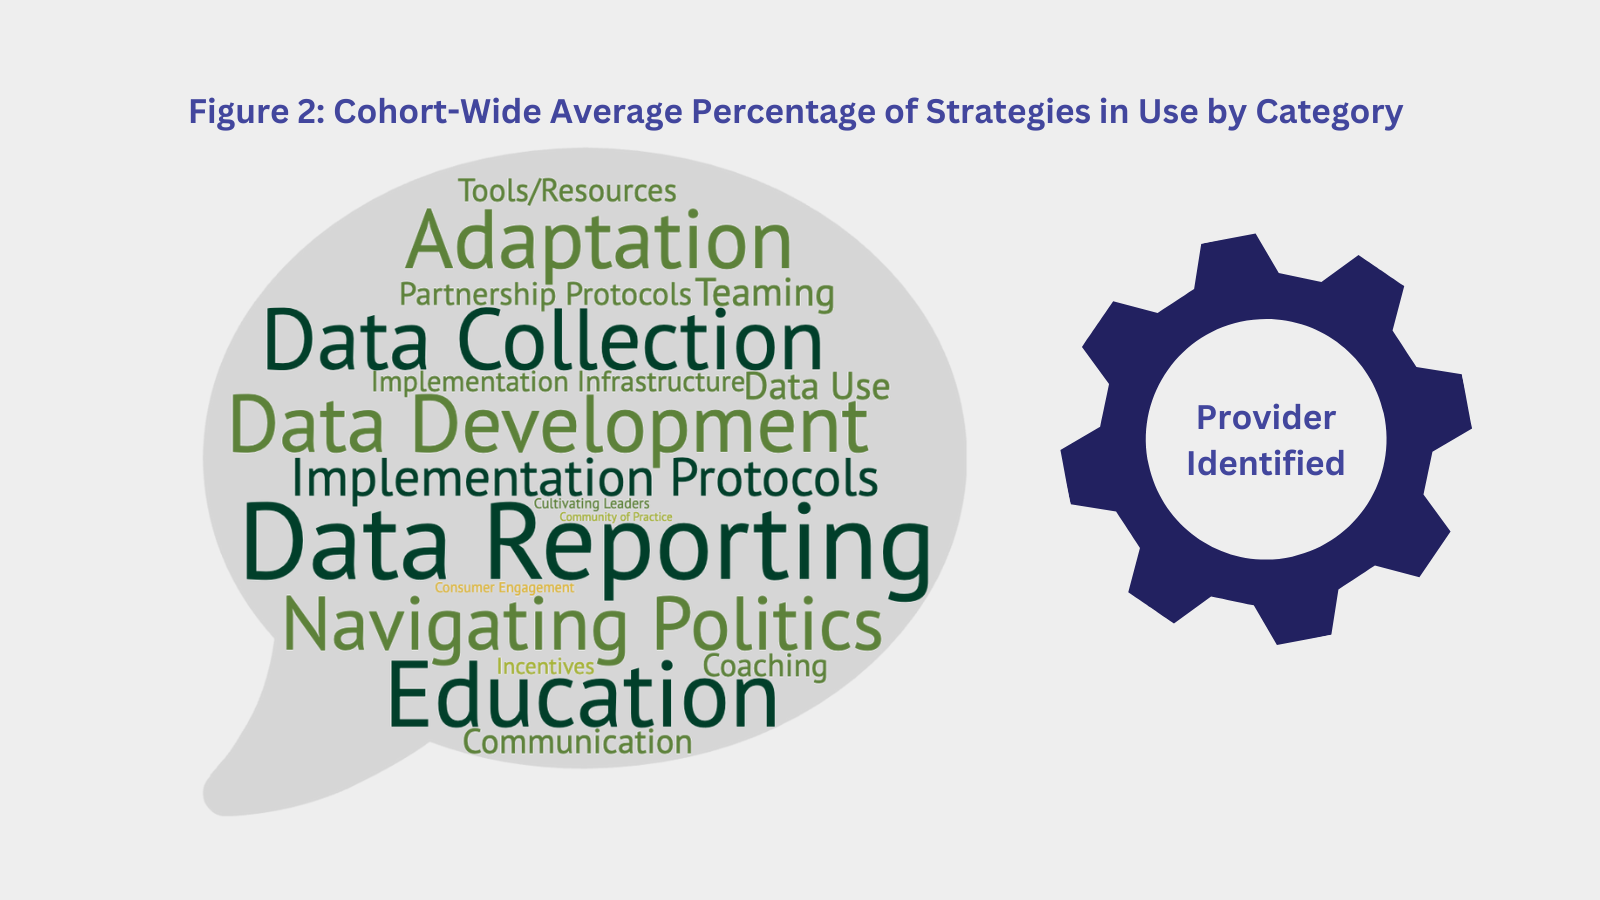
EIC implementation specialists reported which of 57 strategies were in use for each district based on a review of implementation plans, observations of the district implementation team, and discussions with Providers in support meetings. Additionally, providers reported whether they were using each strategy with each of their districts by completing a spreadsheet via email. Implementation specialists offered to meet with providers as a resource if needed; however, all providers completed the spreadsheet without requesting a meeting. Hutto Independent School District was the only district not reported on by a provider.
The 57 strategies were bucketed into 18 categorical groups to reflect common goals of strategies (e.g., education/professional learning; data collection; see Appendix A for more detail). Descriptive statistics were run on an aggregate of total strategies in use and the number of strategies in each category. Inferential tests (t-tests, ANOVAs) were also run to determine how strategy use varied by contextual factors (locale, governance structure, and leadership stability). The small number of dyads (N = 19) prohibited using more complex analyses, such as cluster analysis or latent profile analysis, to determine whether there are similar groupings of dyads.

Results, Implications, Limitations & Next Steps


Overall, how many strategies are in use by each dyad?
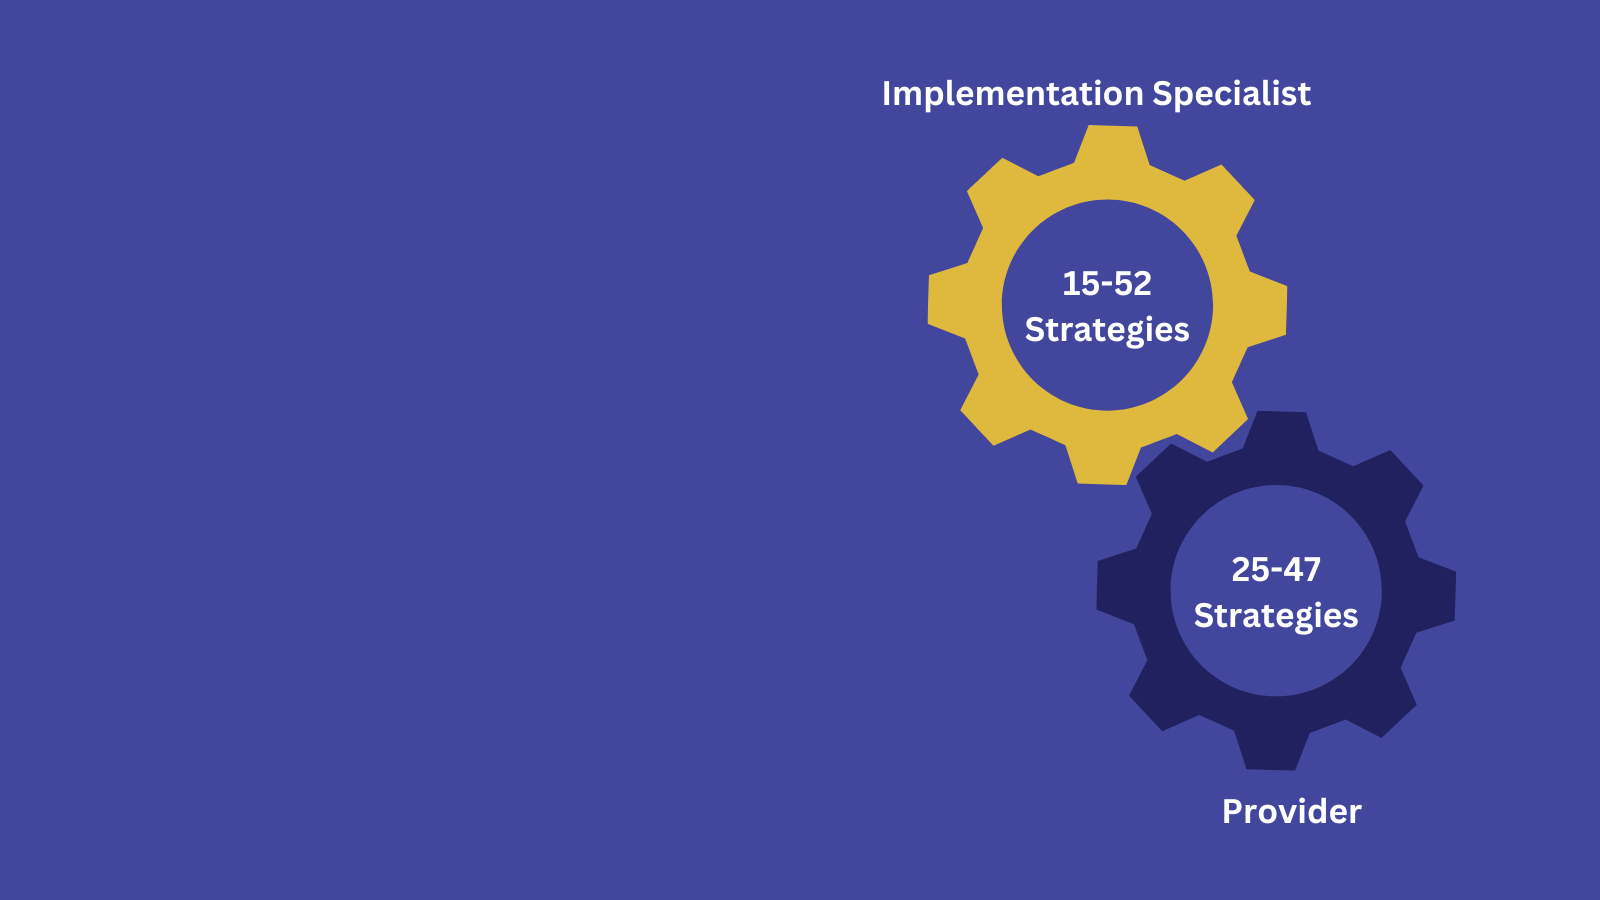
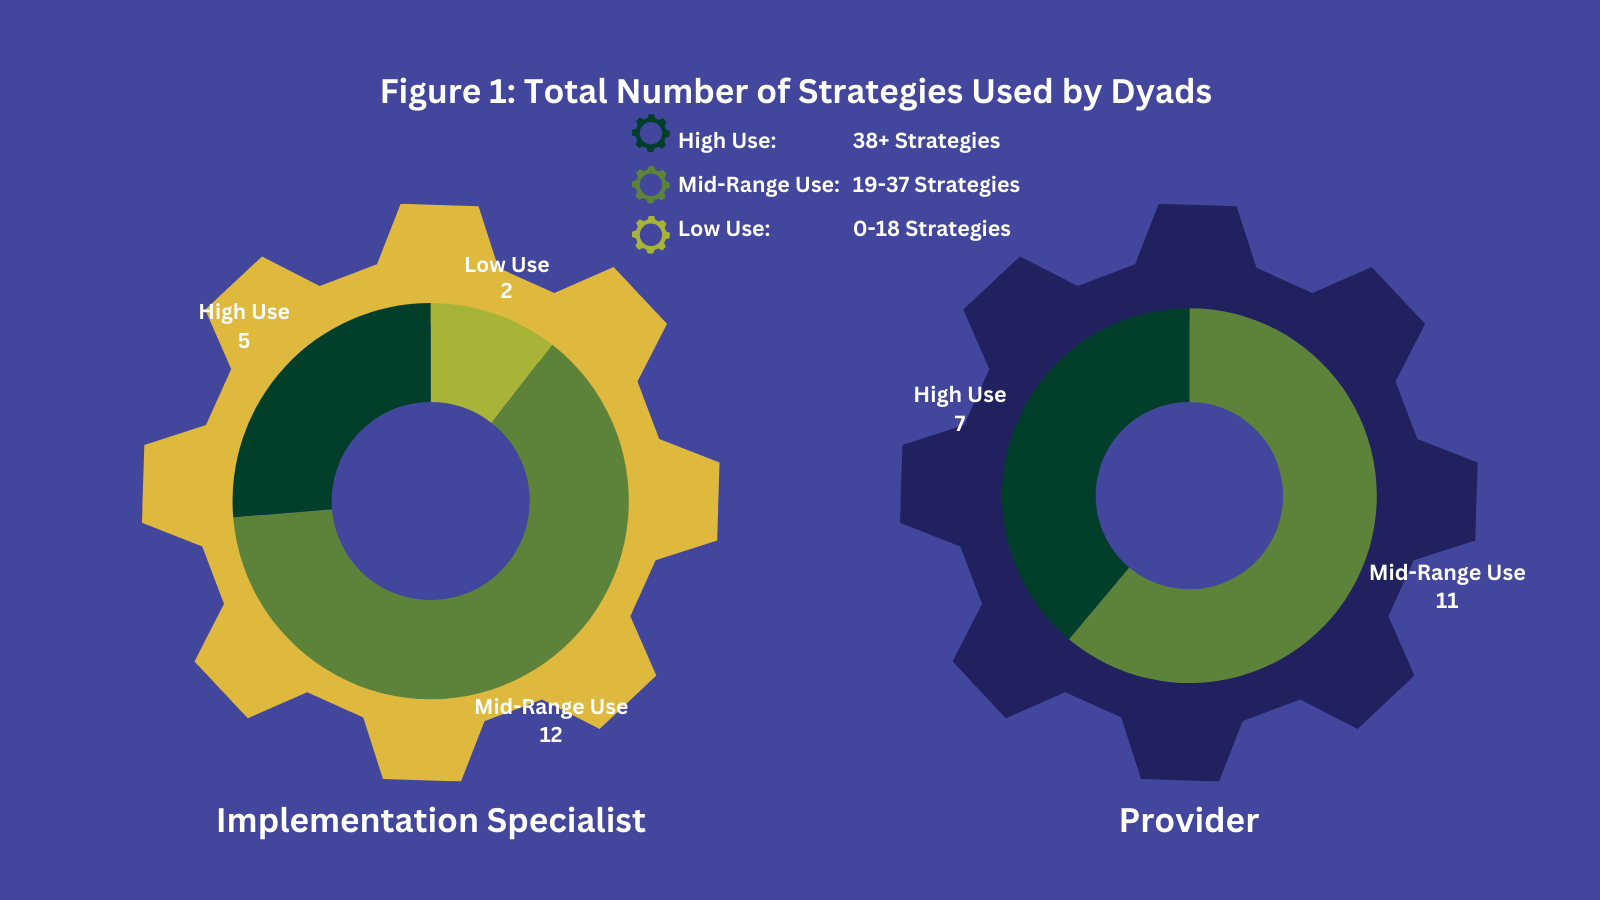
Implementation specialists reported that the number of strategies per LEA ranged from 15 to 52 (M = 31.53, SD = 10.522).
Providers reported a strategy range from 25 to 47 (M = 35.39, SD = 6.775).
Variability in strategy use was typically captured at the provider level by implementation specialist report, whereas it was more mixed between the provider and LEA levels by provider report. This difference may be because implementation specialists are not present in all of the Provider/District meetings or all strategies are not being reported within documentation such as implementation plans.
For those strategies being used by Providers, clear transition plans are needed for how districts will uptake the strategies or discontinue use. For those dyads with a high number of strategies in use, careful evaluation is needed to determine whether all strategies need to be maintained. Data regarding the quality of strategies being used in the 23-24 academic year is also being collected.


What Strategies are most often reported across the cohort? Did strategies change?
When examining categories of strategies, the following are consistently used across the cohort: data collection efforts, data reporting, education or professional learning, and implementation protocols.
- Implementation specialists and providers agreed that all (or almost all) dyads were collecting teacher practice data (walkthroughs, learning rounds), using professional learning of teachers (math content, instructional practice), using reminders, and supporting team creation and development (right people at the table) at the district level.
- Implementation specialists also observed almost all dyads creating a data collection schedule, engaging in data discussions with planning/problem solving to monitor implementation using different types of data (implementation, capacity, outcome, process, fidelity, administrative), and using relationship-building strategies (build a coalition).
- All or almost all providers reported using data reports, facilitating or co-facilitating district team meetings, sharing tools and resources, supporting the development and review of implementation plans and feedback, and using observations and feedback.

Categories where strategies are less commonly used include engaging consumers (students, families, and school boards), using communities of practice, cultivating leaders and champions, developing implementation infrastructure, and using incentives.
For those strategies not being commonly reported, support on how to do so may be needed for the Provider and District. Focus groups are planned for Spring 2024 to explore potential reasons as to why they are not in use or what strategies may not be needed. Future analyses will explore relationships between strategy use and its impact on teacher outcomes.
See Figure 2 for the average percentage of each category reported in use across dyads.
Compared to strategies reported in the first quarter of 2022-2023, significant increases in the mean number of strategies used per category were seen in two categories (as reported by implementation specialists) when examining the entire year.
- Navigating politics and priorities increased (Q1 M = 1.47, year M = 1.68), which was driven by reported increases in visiting other sites where implementation has been successful. Note that this change was specific to two providers and their districts.
- Communities of practice (COPs) also increased, although overall still remained one of the lesser-used categories (Q1 M = 1.36, year M = 1.84); specifically, coaching COPs for teachers and coaches, as well as learning collaboratives generally, were reported more frequently, whereas coaching COPs for principals stayed the same and coaching COPs for district staff were reported less frequently.
These increases may reflect true changes in strategy use or improved awareness of strategies by implementation specialists as the year progressed, and they had more opportunities to meet with providers.
Provider report was only obtained for the entire year, so changes could not yet be assessed; however, changes will be examined across years once data is collected on the 23-24 school year.


How do the types of strategies in use vary by context?
Overall, a pattern emerged that implementation specialists and providers generally reported districts with appointed superintendents to use significantly or marginally significantly more strategies across several categories (for specific statistics, see Appendix B). Both reporters noted that such districts use more communication and problem-solving strategies.
Implementation specialists noted districts with appointed superintendents used significantly more total strategies, adaptation, use of communities of practice, strategies for cultivating leaders and champions, data collection strategies, data reports, data usage, implementation infrastructure, and marginally significantly more teaming and sharing of tools and resources.
Providers reported that districts with appointed superintendents used significantly more incentives, and marginally significantly more total strategies, data collection strategies, implementation infrastructure strategies, implementation protocols, and partnership protocols.
Implementation specialists reported that districts with transitional leadership were using more strategies for cultivating leaders and champions and marginally significantly more strategies for data collection, data usage, implementation infrastructure, and implementation protocols; however, no differences were found in leadership stability when examining provider-reported strategies.
Rural districts were reported to be using marginally significantly more adaptation strategies than suburban districts and marginally significantly more community of practice strategies than urban districts when examining implementation specialist reports. According to the provider report, rural districts were using marginally significantly more total strategies than urban or suburban districts; significantly more strategies focused on consumer engagement than urban districts; and significantly more data collection and implementation infrastructure strategies than suburban districts.
Findings related to rural context should be interpreted cautiously; only three districts are rural, and two share a provider.
Tailoring implementation strategies requires deep knowledge of the local actors and context. Some level of tailoring is evident in the results. Focus groups will be conducted in Spring 2024 to gain further insight into dyads’ perceptions of how well their strategies are implemented and their reasoning behind selecting some but not others.
About the Effective Implementation Cohort

The overall aim of the Effective Implementation Cohort (EIC) is to increase district capacity to implement a high-quality middle-year math curriculum as part of a Coherent Instructional System to accelerate learning for students. The EIC Team seeks to support partnerships between providers and Local Education Agencies in their implementation and measurement efforts, as well as to collect and study data to answer the learning questions within the EIC Learning Agenda.